Another year of project management has rolled by and that means it is time to review your stats!
Take a 5 minute break and check out how much have your project management habits changed since 2016 Stats.
Country of Origin
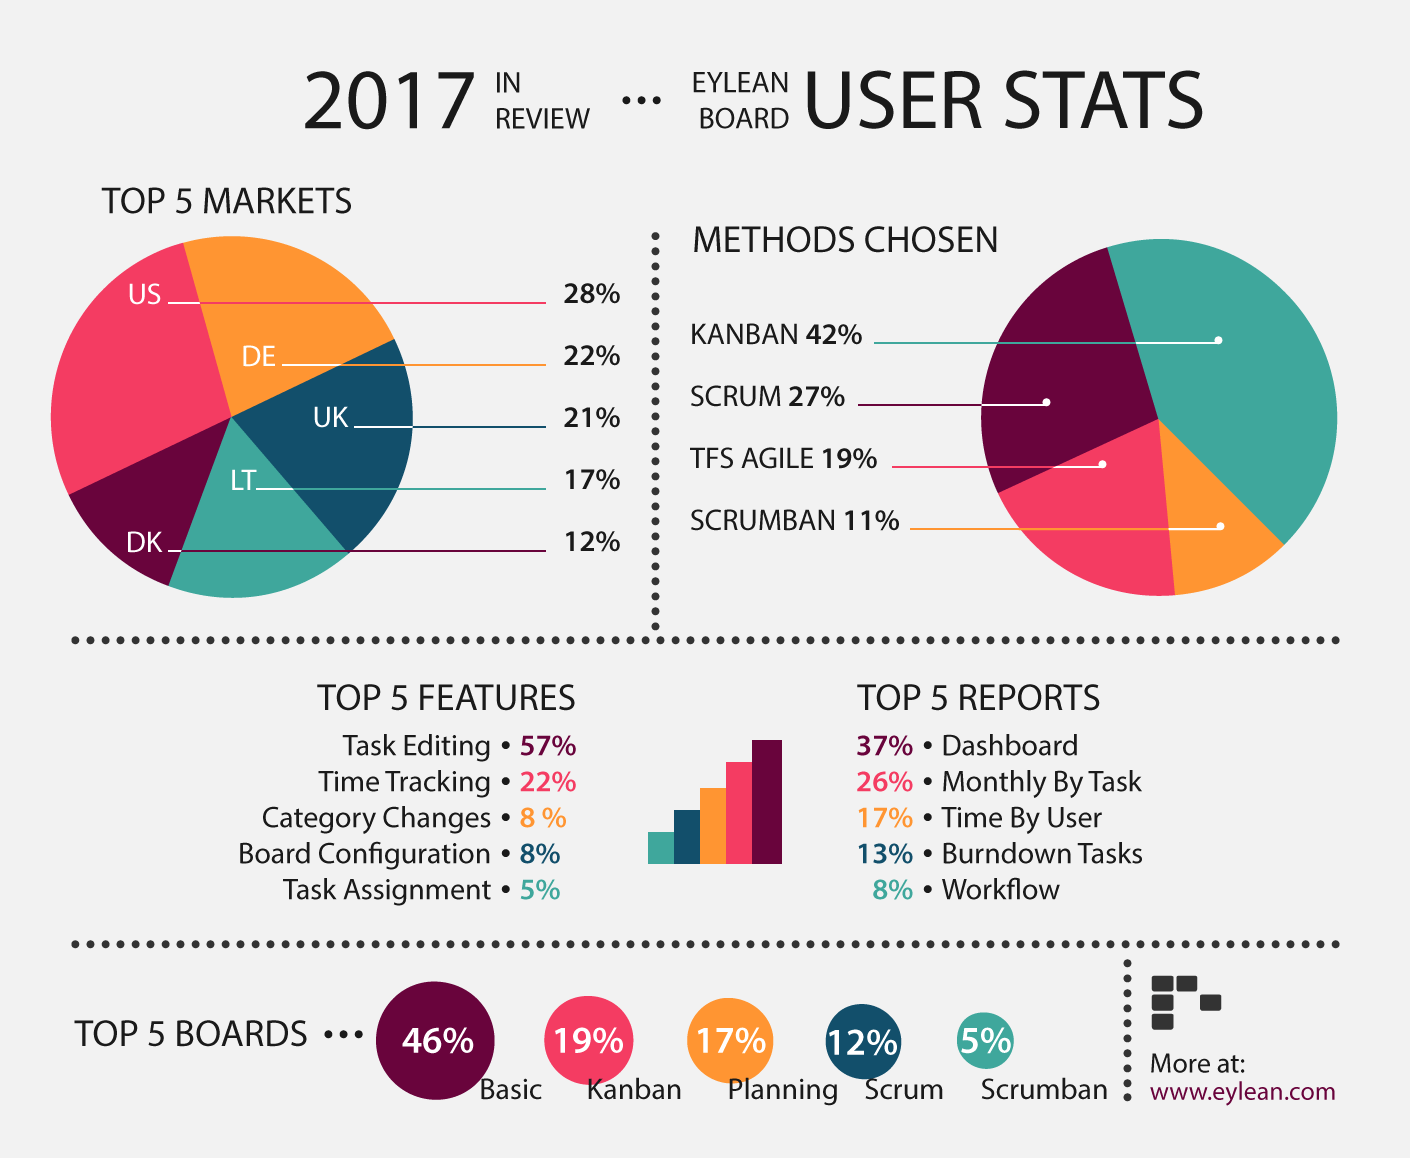
As you will notice right from the start, most of the top charts have remained the same. For the Top 5 Markets we still have a strong five of United States, Germany, United Kingdom, Lithuania and Denmark. Meaning project management usage is staying strong within the western markets.
Methods Chosen
The same situation with sligthly shifted percentages can be observes in the methods you have chosen to use. The biggest shift can be noticed in the usage of Scrumban, which has falled from 16% to 11% in 2017. However it is still among the top 4 along with Kanban, Scrum and TFS Agile.
Features and Reports
Little change is seen in the Top 5 features and reports with only two newcomers this year. On the feature side, Task assignment pushes out synchronization with 5% in 2017. And instead of Cummulative Flow Diagram, you chose to use the Workflow report more often this year.
Project Boards
The biggest change in 2017 was observed in the boards you have chosen for your project. While the basic board remains to be the absolute favorite, the usage of Kanban and Scrum boards has risen. And instead of TFS Scrum and TFS Agile, we have two newcomers into our top 5 – Planning and Scrumban boards.
Check out the full report below!


