 While 2016 is over and we are well into the 2017 there is still one more thing to do before we completely move on. That is reflection upon how have you used Eylean Board in 2016, what trends did you follow and how will that likely change in the future. So before any further ado, let’s review!
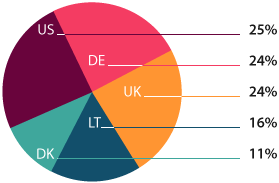
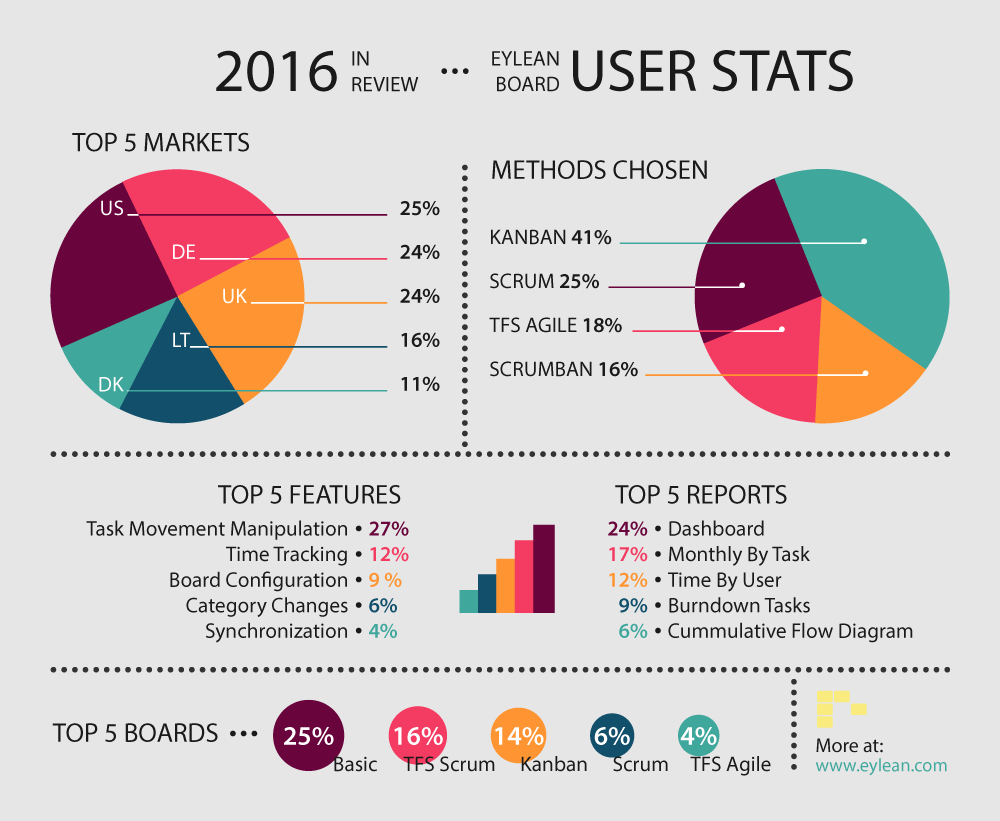
2016 has only changed the top 5 of our customer markets a little bit. In the first place we have the United States with 24.70%, followed closely by European markets – Germany at 24.48% and United Kingdom at 24.17%. Since our international client base is increasing, our home court user base is getting relatively smaller with 16.43% and the fourth place, while the fifth place is taken by Denmark with 10.75%. It is clear that there has been some movement in the top 5 markets where Eylean Board is used, the trend of strong western markets remains for now.
Methods Chosen

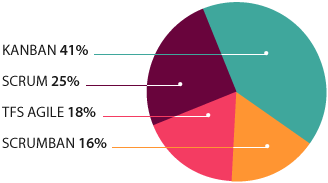
Just like in 2015, Kanban keeps a strong first position amongst the Eyleaners. However, it diminishes a little from 47% to 41.03%. Number of Scrum users lessens a little as well from 28% to 25.43% in 2016, all keeping with the trend of moving past Scrum into looser and more flexible management approaches. While the two leaders falter, the seeming underdog Scrumban climbs from 13% to 15.60% and TFS Agile users grow the most up to 17.94% in 2016.
Top 3 Boards
While it may seem that the top boards should relate a similar methods as the methods, they don’t. The number one choice with 25.11% is the Basic board, followed by TFS Scrum at 15.53% and Kanban at 13.70%. While it may seem odd, the Basic board is great choice for those using Kanban or any other method, as it allows to start fast and build up the processes as the team goes. TFS Scrum board proves to be a great choice for the TFS users that crave more functionality and there is little surprise to see the Kanban board in top 3 with the majority of Eyleaners practicing the method.
Top 3 Features
There is less dramatic changes in the top features category with Task Movement Manipulation and Time Tracking staying firm in the first two positions. However, the third place is somewhat of a newcomer with Board Configuration. While it was always a greatly appreciated feature of Eylean Board, the ability to customize the board has never been amongst the top 3, which speaks about growing interest and need to modify and accustom the board to each team’s needs.
Top 3 Reports
The strong overall leader with 24.38% is the Dashboard providing clear and fast information on what is happening within the project and with each member of the team. Monthly By Task report stays firmly in the second place with 17.11% and Time By User is found in the third with 12.23%. It is clear that teams appreciate both – seeing a quick overview of the whole picture and getting down to the details for each user.
The stats of 2016 reflect a clear move towards more diverse Agile methodologies with Scrumban on the rise. It also speaks volumes on the necessity of customization and personalized decisions for each teams needs and situation. Which it seems will only grow larger in the future.
Enjoy the full infographic and share your insights from 2016!


